The international scientific and analytical, reviewed, printing and electronic journal of Paata Gugushvili Institute of Economics of Ivane Javakhishvili Tbilisi State University
VALUE CREATION IN THE INSURANCE SECTOR OF GEORGIA
Abstract
In the modern globalized world with rapid and complex changes, cross-border mergers and acquisitions, capital and investment movements, companies need more sophisticated and advanced indicators to measure performance. Emerging markets is considered to be “growth engine “of the global economy, whereas economic growth drives growth in insurance sector with the emerging markets. Thus meeting these challenges in insurance business requires application of modified concepts and measures for performance evaluation.
The main challenge for the management of an insurance company, is to define the key drivers of the value creation process, and control them in order to receive benefits in the long run. In order to conduct the valuation in Georgian insurance industry, we decided to apply Economic Value Added approach, which is relatively new concept, to evaluate how actually this business performs.
Keywords: Economic Value Added, Insurance, Risk, Capital Cost, Cost of Equity, Risk Premium, Valuation.
Actuality.In financially developed world, insurance companies are very important participants in the financial market, especially in the capital market. They play very important role as they contribute to the strengthening of competition, stimulate financial innovation and contribute to market integrity increase. Modern financial markets are characterized by globalization and due to increased risk of devastating natural disasters and terrorism, which is now very influencing factor on the insurance sector, there is an integration of insurance companies in the global market in the form of acquisitions and mergers. This leads to the formation of market giants who have huge resources and represented as key players that have significant impact on price movements in the global capital markets. Since1990s, after Soviet Union had officially ceased to exist and Georgia became independent country, transformation process in political, social and economic structures has been in force. During that period, which lasted over 70 years, the state was the sole provider of insurance services. Therefore transition process from centralized style economy to market oriented structure requires considerable time, effort and resources. Despite the fact the Georgia successfully implemented many reforms in different sectors of economy, and has sufficiently well-developed banking sector, improvements in insurance market is not as impressive. It’s clear that insurance sector in Georgia is very promising, but there are number of constrains, such as “insurance culture”, lack of appropriate knowledge, low incomes of population and appropriate government regulations.
In leading industrial countries, stock markets are represented by a number of financial institutions, most of which are invested by insurance companies. Thus, in developed financial markets, insurance companies are one of the major institutional investors. Development of the insurance industry in Georgia counts over two decades and continues gradually growing up, but input in country GDP is very low comparing to European countries and varies in the range 1-1.5%. By the end of 2018, total number of insurance companies registered and licensed accounts for 17, but none of them are listed in Georgian Stock Exchange. It seems that companies don’t have a stimulus to become the public enterprise because of the unequal dispersion of Georgian financial market.
Georgia practices voluntary types of the insurance. But underwritings from traditional types of voluntary insurance are not very impressive due to the lack of motivation among potential insurers. This trend is common for developing countries where the level of life and population income is comparably low. In the society, where the people are forced to fight for survival and companies mostly incur losses, it’s very difficult to promote different insurance products successfully. In 2013-2014 health insurance programs developed and implemented by private insurance companies had been replaced by the state healthcare program that negatively affected generated written premiums.
During 1990s, worldwide trend in insurance market was focusing on profit margin, growth measures and volume. Increasing competition in industry caused price decrease on insurance products and respectively affected selling volume; as a result many insurance companies suffered losses. Consequently insurance companies shifted focus from volume to other value drivers, as became obvious that only volume measure is not enough for business success.
In 1964 Peter Drucker writes “Managing for Results” and in 1986 Alfred Rappaport writes his book “Creating Shareholder Value”, later in 1994 Jams McTaggart, Peter Kontes and Michael Mankins use the term “value based management” in the book “Value Imperative”. These, and many other scholars made statement, that primary goal of any business is increasing shareholder value. From then to now many value methods and measurements were developed to determine value of companies, investments and even separate divisions of the entity.
Conducting valuations in emerging markets proves to be a complex issue as the popular models may not be quite appropriate to deal with against the specific local economic. Valuation is much more difficult, because risks and obstacles are greater than they do in developed markets. As the economies of the world globalize and capital becomes more mobile, valuation is gaining importance in emerging markets, such as Georgia’s.
Formulation of the problem.The main purpose of research is to define the key components of the economic value creation process, and through their control, allow the insurance company to create value in the long term. After the main components influencing economic value are identified, the economic value added indicator for the entire industry to be calculated and based on this measure the main trends in the insurance industry of Georgia is defined and analyzed.
The main challenge for the management of an insurance company, as for other businesses, is to define the key components of the value creation process, and control them in order to receive benefits in the long run. There are various approaches and models applied to the analysis of insurance enterprises financial data, but we focus on Economic Value Added (EVA) approach, that is the financial performance measure that is considered to be the most realistic in capturing the true economic profit of an enterprise (Damodaran, 2006). The origins of EVA are rooted in the theory of the firm valuation originally developed by F. Modigliani and M. Miller in the late 1950s. Their work lead to development of the discounted cash flow (DCF) model of valuation, which then was developed by Stern Stewart. Thus, EVA is modified version of DCF and represents trademark of the consulting firm “Stern Stewart & Co”, which implements EVA concept for large companies, such as Coca-Cola. This measure is highly accurate because it includes the cost of debt and equity financing. As proposed by David Young and Stephen O’Byrne in the book “EVA and Value-Based Management” – since you can calculate EVA for private entities or for divisions within companies, you can use it as a motivational tool within your organization.
Economic value creation in insurance business occurs when the sum of all sources of revenue, including underwriting and investment income, exceeds the sum of all expenses, including internal operating expense and external costs of capital. All these measures should be time value reflected. EVA is an economic profit, which is calculated based on financial reports – statement of financial position and statement of profit and loss. The main difference from other traditional tools is that EVA goes for adjustments to accounting data to make it economically viable (Liu Cheng, 2011). Most of the analysis performed is focused on internal information, such as company revenues and expenses, often ignoring such factors, as capital flows and its cost. In order to create value, the management of an insurance company must consider all factors that impact the financial performance of the company, both internal and external, especially, taking into account cost of equity, which is ignored when calculating accounting profit.
The main idea of economic value added approach is that the cost of insurance company funds acquired must be less than the value derived from their investment. Insurance companies derive funds from equity, debt, and policyholder funds that support net insurance liabilities. If the income on invested assets is less than the cost of those funds, then economic value added is negative, which means that value is destroyed. Therefore, the difference between return rate and cost rate, called spread, is very important indicator, which has to be controlled. If the spread is positive, economic value is created, if it is negative, than it is destroyed. Thus amount of value created can be represented as a spread multiplied by capital invested.
EVA = (ROIC – WACC) x IC ,
Where,
ROIC – Return On Invested Capital
WACC –Weighted Average Cost of Capital
IC – Invested Capital
The main subject of discussion among analysts is the method of valuation of cost of capital and there is no universal method agreed. In our research we use method and proxies provided by Professor A. Damodaran, who is a worldwide recognized expert in valuation.
As we have already mentioned, in insurance industry funds are derived from three basic sources - surplus (equity), debt and policyholder funds. Insurance companies sell protection to their customers, who pay premiums that are subsequently invested to cover future claims or benefits, administrative expenses and profits to shareholders (Balban, 2013). Generally, in this business, companies are required by regulator to hold sufficient reserves to insure paying-out expected claims. It is required that insurers do not rely on new premiums to pay for claims and benefits underwritten in the past. Reserves generated by the insurance companies are invested until they are needed for pay-outs. Therefore, investments on the insurer’s balance sheets include reserves for expected claims and benefits (Young,... 2001).
Based on the above, underwriting, investment and finance are main activities which contribute to the overall performance of the company. For calculation of EVA we make only necessary adjustments in figures from balance sheet and profit and loss statement, to arrive at real economic profit figure (Young,…2001). The main adjustments are:
- Expenditures on research and development, promotion and employee training should be capitalized;
- Depreciation charge is added back to profit and instead, a charge for economic depreciation is made. This reflects the true change in the value of assets during the period, unlike accounting depreciation;
- Accounts such as provisions, allowances for doubtful debts, deferred tax provisions and allowances for inventory should be added back to capital implied;
- Non-cash expenses should be added back to profits and to capital employed;
- Operating leases should be capitalized and added back to capital employed;
- Tax charge will be based on cash taxes, rather than the accruals-based methods used in financial reporting.
The process of calculation consists of 4 stages:
1. Calculation of Net Operation Profit After Taxes (NOPAT);
2. Calculation of Invested Capital (IC)
3. Calculation of Weighted Average Cost of Capital (WACC)
4. Calculation of EVA
When calculating NOPAT, we should add interest expenses to EBIT (Earnings Before Interest and Taxes), in order to be sure that our NOPAT figure has not been reduced by interest paid and that NOPAT captures the profits that accrue for all capital holders, including lenders. Then in order to convert accrual to cash, increase in allowance for bad debts should be added back, because increasing of this account does not reflect a reduction in cash, but shows an anticipation of future cash losses. Debt and equity equivalents should be capitalized, for example, implied interest on operating leases should be added back to profit figure. The last step in determining NOPAT is to subtract out cash operating taxes that a company would actually pay with cash, from net operating profits (Damodaran, 2010).
Capital Invested includes short-term debts, interest, taxes and dividends payables, also bond payables, common stock and retained earnings. In other words we exclude current liabilities, such as customer advances, accounts payable, and accrued liabilities. The easiest way to calculate IC is to subtract NIBSTL (Non-Interest Bearing Short-Term Liabilities) from total assets figure of balance sheet (Liu Cheng, 2011, Damodaran, 2010).
As above mentioned, EVA represents difference between net operating profit after taxes and capital charges, which equal to the product of weighted average cost of capital and total capital invested. Cost of capital includes cost of equity and cost of debt. As none of analyzed Georgian insurance companies have bonds and derivatives, we use bank business loan rates for cost of debt.
An insurer’s cost of equity capital is the rate of return required by its equity investors. Therefore it is measured as the risk free rate of the equity and a risk premium. For the risk free rate is usually used ten years treasury yield, and the risk premium is estimated using proxies for the riskiness of equity and the pricing of that risk. There are different approaches for valuating risk and estimating the cost of equity capital, but the most common approach is Capital Asset Pricing Model (CAPM). The main idea of the CAPM is that the risk can be systematic, which is related to the overall market, and non-systematic (or idiosyncratic), which is specific to the individual stock. According to the CAPM, idiosyncratic shocks are not taken into account because their impact can be eliminated by holding a diversified portfolio. But systematic risk cannot be diversified away and therefore requires a risk premium. Systematic risk is called beta and estimated using a time series regression of the stock’s return on a proxy for the market return such as the S&P 500 (the “market model”). The risk premium is then calculated as the product of beta and an estimate of the equity risk premium. Over the years, the market model has been modified and extended by macro factors, such as unexpected inflation, unexpected changes in interest rates (Boyer,... 2017). In insurance industry very important proxy for financial risk is financial leverage, because it has additional effects on risk, as high-debt firms are more sensitive to changes in interest rates and credit spreads.
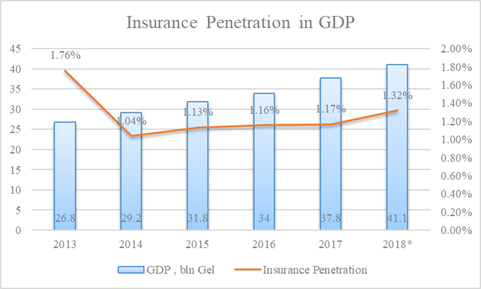
Analysis of the insurance sector of Georgia. We have analyzed all 16 companies of Georgian insurance sector during 2013-2018. The results have shown that despite the 15.10% increase in insurance premiums that had been demonstrated since 2013 till 2018, the level of insurance penetration in GDP is still low and accounted for 1.32% of GDP in 2018 (chart 1). Meanwhile, in OECD countries, the share of insurance against GDP varies from 1% to 20%. The leader is Luxembourg, where the ratio of insurance premiums to GDP is 38.8% due to life insurance more than 33%[1] .
Chart 1. Insurance Penetration in Georgia’s GDP 2013-2018
Insurance market in Georgia represented by different insurance products and detailed structure is shown below in chart 2.
Chart 2. Georgian insurance market structure.
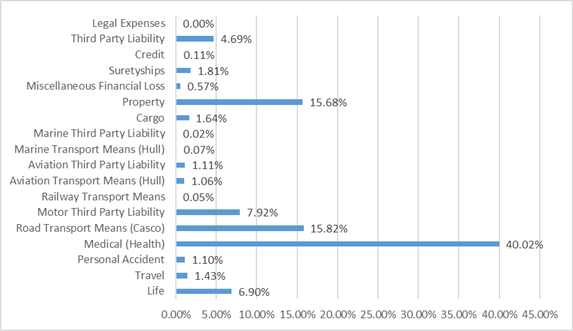
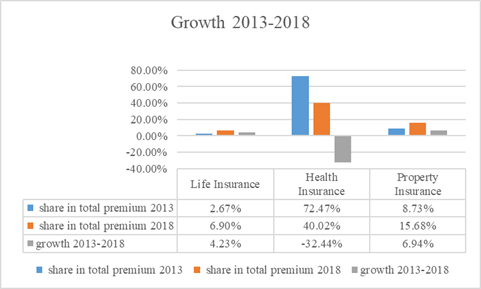
The most significant role plays health insurance, though it decreased by 32.44 % and now represents 40.02% of total written premium. This fall was caused by regulatory changes in insurance sector, as government has formed Public Health Insurance and as a consequence, demands on private health insurance decreased and partly substituted by government insurance. Despite this fact, property insurance increased from 8.73% to 15.68%, and life insurance increased from 2.67 to 6.90 %. As we can see, there is a positive upward trend (chart 3).This data is taken from insurance state supervision state service statistics (see table 1).
Table 1. Statistical data.
|
GEL |
Life Insurance |
Health Insurance |
Property Insurance |
Total Premium |
|
2013 |
12,597,173.00 |
341,377,598.53 |
41,141,934.66 |
471,066,119.68 |
|
2018 |
37,434,561.24 |
217,011,722.81 |
85,003,146.41 |
542,200,592.33 |
Chart 3. Growth Rates for Life, Health and Property Insurance 2013-2018
We have analyzed all insurance companies consolidated data represented on the Georgian insurance market. First step was to calculate net operation profit after taxes (see table 2) with following adjustments to earnings before income and taxes:
Table 2. Adjustments to EBIT
|
YEAR |
|
2018 |
|
NOPAT |
|
48,458,022 |
|
EBIT |
+ |
48,696,528 |
|
Interest Expenses |
+ |
1,926,525 |
|
Devaluation, bad debts write offs |
+ |
4,517,209 |
|
Cash Operating Taxes |
- |
6,682,241 |
Having made all above mentioned necessary adjustments to earnings before interests and taxes we calculated NOPAT that amounted 48.46 mln GEL. Non-interest bearing liabilities amounted 495.31 mln were subtracted from total assets book value from balance sheet 743.22 to get total capital invested figure that is 247.91 mln GEL. Then, using modified CAMP model, with risk free rate that is 10Y Georgian bond yield 9.07%[2], beta for insurance sector of emerging markets that is 0.47[3], total equity risk premium for Georgia, included country risk premium, that is 10.13%, and having used the formula Rf+beta*ERP, arrived to cost of equity that represents 13.83%. Having in mind, that analyzed companies have only bank loans in interest bearing liabilities, we assume cost of debt is average bank loan rate that is 11.70% (National Bank of Georgia data). Considering debt to equity proportion we came to the weighted average cost of capital figure that is 13.56%.
Economic value is added, if the spread of the difference between return and cost of invested capital is positive. We have calculated return on capital invested, which represents 19.55%, whereas weighted average cost of capital is 13.56%, which means, that spread is positive 5.98%.
As a result, it was revealed, that Georgian insurance industry creates economic profit. When we multiply this rate by invested capital amount, we get the result of EVA in quantitative terms, which is 14.83 mln GEL in this particular case.
Conclusion.Having analyzed Georgia's insurance market from 2013 to 2018, based on the studied materials, calculations done and the results obtained, can be concluded, that insurance market is medium stable, with moderate sustainability, but while stable, insurance penetration in country's GDP is very small, therefore income from investing activities are very negligible.
The reasons of insurance development disruption are the following:
- Low income of the population;
- Non-existence of price-competitiveness of insurance companies;
- Small share of life insurance in total written premiums;
- Undeveloped capital/stock market;
- Level of unpaid or partly-paid claims.
- Lack of appropriate government regulations.
The reasons listed above, cannot be resolved at the level of one particular company, since the primary problem is the level of unemployment, which is directly linked to the level of income and as a consequence reflected in written premiums. State policy regarding temporary compulsory insurance could contribute to create psychological basis for loyal attitude to insurance products. With the growth of infrastructure projects, the demand for insurance to cover the project and the risks during operations will increase.
Despite the fact that Georgian capital market is undeveloped and insurance industry’s input in countries economy is immaterial, this business is steadily developing, continues to grow and manages create economic profit, which is a sign of good potential. The future growth of the insurance sector will depend on how effectively the insurers are able to serve customers, what kind of new innovative products they can offer, how effectively they are able to change the perceptions of the Georgian consumers and make them aware of the insurable risks, an finally, how government regulations support its future progress.
REFERENCES
- ვერულავა თ. ელიაშვილი თ.(2015). სადაზღვევო კომპანიების, როგორც საქართველოს ეკონომიკის ინვესტირების წყაროს გამოყენების პერსპექტივები. სამეცნიერო ჟურნალი "ჯანდაცვის პოლიტიკა და დაზღვევა" N 1. 2015
- ხუციშვილი მ.(2018). საქართველოს სადაზღვევო ბაზრის განვითარების პრობლემები“. სტუ. ყოველკვარტალური რეფერირებადი და რეცენზირებადი საერთაშორისო სამეცნიეროჟურნალი ,,ბიზნეს-ინჟინერინგი"; #1/2; ივნისი 2018; გვ: 127-130.
- Balban M.(2013). Role of insurance company as institucional investitors
- Balaban M. (2007). Insurance in Modern World, monograph, Cikos, Belgrade
- Bingham, Russell E., (1999). Fundamental Building Blocks of Insurance Profitability Measurement.Actuarial Considerations Regarding Risk and Return in Property-Casualty Insurance Pricing, Casualty Actuarial Society, 1999
- Boyer, B., Lim, R., Lyons, B. (2017). Estimating the cost of equity in emerging markets: A case study. American Journal of Management,17(2), 58-64. Retrieved from http://digitalcommons.www.na-businesspress.com/AJM/BoyerB_Web17_2_.pdf
- Damodaran A. (2006). Valuation Approaches and Metrics: A Survey of the Theory and Evidence Aswath Stern School of Business
- Damodaran A. (2010). Economic Profit or Economic Value Added (EVA). Business and Economics
- Dorron Nissim,(2010). Analysis and valuation of Insurance companies. Columbia Business School
- Evans M.H.(1999). Excellence in Financial Management: Creating Value Through Financial Management. p.27. http://www.exinfm.com/training/pdfiles/course08.pdf
- Wilson J., (1997. Economic Value Added. UBS Global Research. http://pricing.online.fr/docs/economicvalueadded.pdf
- Liu Cheng, (2011). Study on the 8. Special Adjustment Methods for Calculating EVA. http://www4.pucsp.br/icim/ingles/downloads/papers_2011/part_7/part_7_proc_55.pdf
- Kantšukov M., Loemaa J., (2012). Estimation of cost of capital in emerging markets: the case of Estonia. Economics and management 2012.17 (1).
- Коупленд Том, Коллер Тим, Муррин Джек.(2008). Стоимость компаний: оценка и управление / Пер. с англ. – М.: ЗАО «Олимп-Бизнес», 2008. – 576 с.
- Koller T., Goedhart M., Wessels D.(2010). Corporate Valuation: Measuring and managing the Value of Companies. McKinsey&Company, 5th add. p. 811.
- Krogger&Co (2015) KEY VALUE DRIVERS. http://www.krogger.co/key-value-drivers.html
- L.E.K. Consulting. Identifying and Managing Key Value Drivers. Vol1, issue 1. http://www.lek.com/sites/default/files/Volume_I_Issue_1.pdf
- Young D. O’Bryne (2001). Value Based Management. Practical guide. Professional publishing McGraw-Hill NY
- http://people.stern.nyu.edu/adamodar/pdfiles/papers/valuesurvey.pdf
- https://stats.oecd.org/Index.aspx?DataSetCode=INSIND
- http://people.stern.nyu.edu/adamodar/New_Home_Page/data.html
- http://people.stern.nyu.edu/adamodar/New_Home_Page/lectures/eva.html
- http://www.evanomics.com/evastudy.shtml
- https://data.oecd.org/
- www.nbg.gov.ge/
- http://insurance.gov.ge/Statistics.aspx
- https://www.geostat.ge/
- www.gse.ge/